<div style='background-color: none transparent;'><a href='http://www.rsspump.com/?web_widget/rss_ticker/news_widget' title='News Widget'>News Widget</a></div>

Factors Influencing Environmental Accounting Information System Design

Jan 21, 2012 1 comments

An entity's environmental strategy indicates both the entity's dedication and motivation to incorporate environmental stewardship in its daily activities; this may affect both external and internal reporting demands of an environmental accounting information system. A firm only interested in legitimizing its actions to society or appeasing its stakeholders (Islam and Deegan, 2008) may outfit their information system differently than a firm that finds it economically beneficial to aggressively pursue an environmental stewardship strategy (Clarkson et.al., 2008). Also, governmental and not-for-profit entities may have different considerations from for-profit firms when developing their environmental strategies since no profit motive exists (Ball, 2005; Herbohn, 2005). Even within governmental agencies, strategies will vary depending on whether an objective relates to environmental stewardship of the agency's actions or establishment and enforcement of environmental regulations (Cormier et.al., 2004) for a model on corporate environmental reporting, which considers company management assessments of stakeholder influences on a company's environmentally related actions).

Stakeholders' power (or lack thereof) to influence an entity's actions can impact the entity's environmental objectives and strategies (Aerts and Cormier, 2009; Darnell et.al., 2009; Magness, 2006; Neu et.al., 1998). Communications from an entity's management concerning environmental issues may positively or negatively impact the development of a system, as noted in a number of case studies (Ball, 2005; Dey, 2007; Herbohn, 2005). Thus, an entity's strategy towards environmental stewardship will impact the environmental accounting information system developed, and the types and level of management communications on environmental issues moderate this effect.

Experimental methods can contribute to the literature by focusing on these factors in ways that extend the archival and case study findings. Specifically, the reported associations within these studies can be extended with experiments to better understand why the associations exist. Environmental strategies can be manipulated in a laboratory setting (e.g. stakeholder appeasement strategies, pro-environmental versus pro-economic strategies, etc.) to help determine which entity strategies result in certain manager decisions that influence the ways that environmental data are implemented into an accounting information system. Stakeholder influences can be manipulated (e.g. strong external pressures, weak interactions with the entity, etc.) and studied to observe how decision makers respond to these pressures when forming the entity's environmental strategy. The model suggests that the environmental strategy employed determines the way in which an entity's environmental information system is implemented.

Environmental accounting information systems
After considering how stakeholder influences and an entity's environmental strategy molds the implementation of an environmental information system, the model emphasizes considering data organization and data quality in designing experiments on environmental accounting information systems. Relative to traditional accounting information, environmental accounting information comprises lower levels of user familiarity (Gray and Bebbington, 2001), which may hinder effective processing of this non-traditional data. This unfamiliarity may very well be contributing to the resistance organizations experience when an environmental accounting initiative struggles to make progress (Ball, 2005; Dey, 2007; Herbohn, 2005).

Experiments can explore any potential underlying psychological mechanisms that may contribute to organizational resistance (Ball, 2005) or cognitive difficulties (Kaplan and Wisner, 2009) associated with effectively using environmental data. The current literature is mainly silent on providing these types of explanation; experiments have the potential to extend the literature by determining why certain behaviors and decisions are observed.

To provide an example of psychological factors that may be important to explore in an environmental accounting context yet does not receive much attention in the extant literature, consider the following about the nature of environmental data. The organizational display of environmental data, and their combination with non-environmental metrics, warrants a particular and unique concern to decisions involving environmental information because of the unfamiliarity and potential complexity of this non-traditional data. Different types of data organization and different levels of data quality are well-known factors that impact the cognitive processing of information (Schkade and Kleinmuntz, 1994), so it is important to understand these cognitive influences on the capturing and presentation of environmental data in the implementation of accounting information systems. A better understanding of why behaviors and decisions occur would be helpful in determining how to mitigate factors such as cognitive biases in the processing of environmental information. Data organization and data quality are further explored below.

Data organization
The organization component of displayed data relates to the data visual structure (Schkade and Kleinmuntz, 1994). For example, a traditional way to organize a balanced scorecard's data is to classify and present the data in four perspectives (financial, customers, internal business processes, and learning and growth). When new data are considered to be included in the scorecard, there is debate on whether the new data organization should result in a new, fifth perspective, or whether the data should be embedded within the traditional perspectives. In Kaplan and Wisner's (2009) study, these "new data" are environmental metrics. In their experimental design, the data organization's manipulation includes a four-perspective scorecard in which environmental data embed within the traditional four perspectives, or a five-perspective scorecard in which a standalone fifth perspective isolates and groups environmental data together.

Another way to analyze data organization in an evaluative context includes considering its evaluation mode. In separate evaluation (SE) mode, alternatives are presented and evaluated sequentially. In joint evaluation (JE) mode, alternatives are presented and evaluated jointly (Fischhoff et.al., 1980). For example, assume a manager must analyze evaluations from three employees who are competing for the same promotion within the firm. If the employee analyzes the candidates for promotion in SE mode, then the manager will analyze each candidate's information one at a time. She will finish analyzing the first candidate before moving on to evaluate the second candidate. However, if the manager evaluates the candidates in JE mode, then she will analyze the candidates' information together and at the same time. When alternatives are analyzed in JE mode, direct comparisons can be made between the alternatives (and thus establish a reference point) that are not available for evaluations made in SE mode.

Environmental Disclosures and Economic Performance

Jan 20, 2012 0 comments

A second general category of archival research explores the relationships between environmental disclosures, environmental performance, and/or financial performance. Overall, the results vary in the direction and magnitude of these associations. Li et.al. (1997) find increased disclosures of environmental information when firms are more likely to pollute, when stakeholders become more aware of the firms' environmental liabilities, and when threats to obtaining regulatory costs decline. Cho et.al. (2006) find that companies with higher political lobbying efforts have increased environmental disclosures and lower environmental performances, suggesting a management strategy to influence environmental regulatory procedures. Patten (2002) finds a negative correlation between environmental disclosures and environmental performance, and the correlation is more pronounced among firms in non-ESIs. Social and political pressures may explain the negative correlation. Bad environmental performance leads to pressure to disclose, and ESIs are not affected as much by this pressure because they already receive more scrutiny.

Sociopolitical pressures may also help explain findings of negative correlations between environmental footnote disclosures and both American firms' level of business outside of the USA (fear of being perceived as a polluter) and firms' earnings volatility (fear of bad news exasperating low-earnings periods; Karim et.al., 2006). Cho et.al. (2010) find a similar usage of disclosures when considering the language of US annual reports; the worse the corporate environmental performance, the more optimistic and vague the environmental disclosure language in the entity's annual report.

Al-Tuwaijri et.al. (2004) find different results from Patten (2002) when they consider endogeneity among environmental performance, financial performance, and environmental disclosures. They find positive links, suggesting that environmental stewardship and economic success do not have to be adversarial objectives (see Frooman (1997) and Orlitzky et.al. (2003) for meta-analysis providing general support for a positive relationship between corporate socially responsible behavior and financial performance). Ruf et.al. (2001) use stakeholder theory to explain a broader positive link between corporate social performance and financial performance, suggesting that firms better serve their shareholders when they address other stakeholder concerns. Indeed, environmental disclosures on company web sites suggest that companies perceive environmental issues as a competitive advantage instead of a regulatory burden (Jose and Lee, 2007). In contrast to the above results, Murray et.al. (2006) find no relation between UK companies' stock returns and their environmental and social disclosures. However, there was a positive relationship between a company's level of disclosures and the consistency of their financial returns (i.e. high disclosure levels correlated with consistently high returns, and vice versa).

In another study on market reactions, Blacconiere and Northcut (1997) show that the market-valued environmental disclosure information surrounding US environmental regulations in 1986 (the Superfund Amendments and Reauthorization Act). Specifically, chemical companies with pre-1986 environmental disclosures received better market reactions compared to companies with environmental cost information disclosed by the EPA relating to the legislation and indicating greater environmental cost risks. Investors seem to view corporate disclosures as an indicator of the company adequately mitigating environmental cost risks such as regulatory burdens. This finding supports Blacconiere and Patten's (1994) earlier analysis of a different critical event - the 1984 Union Carbide chemical leak incident in Bhopal, India. In this study, investors also appeared to respond more favorably (i.e. not as negatively) to chemical companies that disclosed environmental information more thoroughly before the incident occurred. Magness (2010) echoes this favorable response to prior environmental disclosures in a study on investor reactions to an accident in the Canadian mining industry. In this study, investors react particularly favorable (i.e. moderate negative reactions) to companies disclosing that they have upper level company involvement in environmental issues. In a sample of pulp and paper companies, Clarkson et.al. (2004) show that environmental capital expenditures yield gains for low-polluting companies, but not their high-polluting counterparts. Also, investors utilize data on companies' environmental performances to assess future environmental liabilities that are yet to be recognized.

Clarkson et.al. (2008) attempt to resolve tension in the different frameworks used to explain the link between environmental disclosures and environmental performance. Specifically, they conclude that US companies involved in ESIs have a positive relationship between voluntary environmental disclosures and environmental performance. These findings support economic theories of discretionary disclosure and not social-political frameworks such as legitimacy theory. However, for companies experiencing pressure for better environmental performance by external stakeholders, the social-political frameworks do provide a structure for predicting disclosures of environmental information when the company has not made a hard commitment to disclose the information.

Overall, archival environmental accounting studies have tested, with much success, the legitimacy framework's ability to support the pattern of environmental disclosures observed among companies. One consequence of the evidence supporting legitimacy theory results in the possibility that firms disclose environmental information simply to gain permission from society to operate. Thus, if society is appeased by only a firm's level of information disclosure (i.e. words but not necessarily action), then improved environmental performance cannot be a guaranteed outcome. This may explain the studies that found no association (Walden and Stagliano, 2003) or failed to find a positive (Patten, 2002) correlation between environmental disclosures and environmental performance. However, other studies reviewed find a positive relationship between disclosure and performance (both environmental and financial), which would support more economic-based disclosure paradigms (i.e. firms disclose because they can back up their information claims, thus it is their competitive advantage to disclose) compared to socio-political frameworks such as legitimacy theory (Clarkson et.al., 2008). Model miss-specification, e.g. not considering endogeneity among the variables, may be driving these conflicting results (Al-Tuwaijri et.al., 2004), so this debate would benefit from more research.

Advantages of archival research methods include analyzing data from a broad portion of the test population, so results can be fairly generalized to the whole population. Since financial data usually captures consistent and high-quality information, archival methods are a good approach to addressing financial environmental accounting inquiries. However, an archival study can only suggest correlations between two variables because the variables are not manipulated and isolated (i.e. "turning one dial at a time") (Shadish et.al., 2002). Thus, the archival method cannot show causation as well as why an association between variables exists.

GCG and Type of Ownership in Banking Industry

Jan 5, 2012 0 comments
According to Caprio and Levine (2002), corporate governance in the banking industry meets two essentials problems: (i) agency problems in banking industry is in very high levels (ii) regulation and supervision that are applied to the banking industry, in a separate level, even can off-set the mechanism of the corporate governance itself. Hart (1995) stated that the corporate Governance arises when the agency problems in internal corporation increase and the transaction cost can not be solved by a contract explicitely. The statement is supported by Fama and Jensen (1983):
“…agency problems arise because contracts are not costlessly written and enforced”
Agency problem in the banking industry has the different dimension with the other industries since there is a regulator’s role which represents stakeholders’ needs. Related with the state-owned bank, agency problems are getting complex since the possibility of the rising of multi agents and principal (Tandelilin, 2004). So that, in the banking industry there is a dimension of principal- agent problems that are different with another industry (Llewellyn and Sinha, 2000).

Agency problems in the banking sector are in two categories. The first is the agency problem caused by debt (agency cost of debt) and the second is the agency problem that related to the separation of ownership and control. Ciancanelli and Gonzalez (2000) stated that the approach the agency theory which are trusted to be existed in order to understand the corporate governance problems in the banking industry has to be reevaluated because of the difference of the basic premise of the agency theory used and the characteristics of the banking industry in spite of the problem of the asymmetrical information that is related to all of the sides.

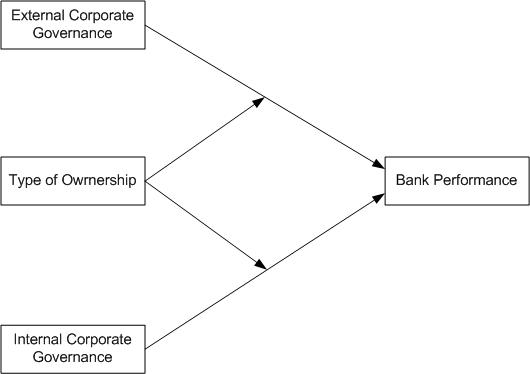
The corporate governance in banking industry is related to two things. First, the external corporate governance with its financial safety nets and prudential regulation. Second, internal corporate governance with its accountability, disclosure, and transparency that departs from creating the arising of the bank system and minimizes the moral attitudes deviation. By using the frame of the corporate governance in banking industry by Ciancanelli (2000), Nam (2004), and Mehran (2003), this research develops three construction : (1) External corporate Governance (ECG) (2) Internal Corporate Governance (ICG) and (3) Type of Ownership.

THEORITICAL FRAMEWORK
Corporate Governance includes (1) set of rules that sets the relationship of the shareeholders, manager, creditor and others deal with the rights and responsibility of each side, and (2) set of mechanism which guarantees direct and indirectly of the application of the set of rules (ADB, 2001). Deal with the banking industry, OECD (1999) described corporate Governance as follows:
……’a set of relationship between the company’s management, its board, its shareholders and other stakeholders. Corporate Governance also provides the structure through which the objectives of the company are set, and the means of attaining those objectives and monitoring are determined. Good corporate governance should provide proper incentives for the board and management to pursue objectives that are interests of the company and shareholders and should facilitate affective monitoring, thereby encouraging firms to se the resource more efficiently’
Macey and O’Hara (2001) stated that corporate governance in banking industry has a wide thought since there is a type of specific contractual that happened in the banking industry, some of them are the protection to the shareholders and stakeholders. Besides that, the specific characteristic of bank needs government’s intervention in the type of regulations and supervisions to control the bank management’s act.

External Corporate Governance
It is clear that developing models of corporate governance in banking requires that we understand how regulation affects the principal’s delegation of decision making authority (Jensen and Smith, 1984) and what effects this has on the behaviour of their delegated agents. (Freixas and Rochet, 1997). Regulation has at least four effects. Firstly, the existence of regulation implies the existence of an external force, independent of the market, which affects both the owner and the manager.

Secondly, because the market, in which banking firms act is regulated, one can argue that the regulations aimed at the market implicitly create an external governance force on the firm. Thirdly, the existence of both the regulator and regulations implies the market forces will discipline both managers and owners in a different way than that in unregulated firms. Fourth, in order to prevent systemic risk, such as lender of last resort, the current banking regulation means that a second and external party is sharing the banks’ risk. (Ciancanelli, 2000).

As the external corporate governance mechanism, banking regulation reflect in safety nets facilities such as deposit insurance (explicit and implicit) and lender of the last resort of central bank. In order to keep financial safety nets from moral hazard, generally, the government applied the prudential regulation and supervision. In this case, Dewatripoint and Tirole (1993) stated that the prudential regulation and supervision mostly meant to keep the bank solvency and as the incentive for stakeholders to control or apply the corporate governance in banking sector widely.

Internal Corporate Governance
The Bassel Committee on banking supervision (1999) stressed that the board and senior management are in fully responsible in apllying good corporate governance. In order to support the effectiveness of editorial board’s work, some aspects are needed to consider about, they are: board’s structure and independency, function and activity, compensation and other obligations (Nam, 2004). The internal corporate government in this research is divided into two; they are internal corporate governance- manager (ICG- manager) and internal corporate governance owner (ICG- owner). The difference of ICG- manager and ICG- owner is in the focus control. ICG- manager stressed to the internal of the manager which is stimulated externally through the attention of the owner to the manager’s interest which is actualized in the remuneration and the other types of another human resource development to increase the bank revenue (Jensen and Murphy, 1990). The ICG- owner stressed in the control throughout the manager to increase the efficiency.

Ownership Dispersion
Ownership dispersion depends on the numbers of shareholders. Practically, the extreme focused types of ownership are often faced in the close private bank. However, the dispersed type of ownership is state-owned bank, because the government act as an agent. Between the both of those extreme points, there is a possibility to the private bank to sell some of their stakes to the public. So that creates the form of majority and minority ownership. Husnan (2001) explained the agency problems to the ownership dispersion in the frame of corporate governance by grouping the company based on the three characteristics of the ownership. The three of the characteristics are (a) dispersed ownership (b) closely held ownership and (c) the state owned firms.

Theoretical background
Conceptually, this research classified the type of the bank ownership into four groups. They are:
  • Foreign or joint venture bank
  • Private unlisted bank
  • Private listed bank
  • Government (state-owned) bank
Each of these ownership types has different level of agency problem. In this case the foreign bank is the banks that have reputation and internationally trusted which are sure for the market to apply good corporate governance. Generally, the closed private banks are controlled tightly by ownerships in the relatively small number.

This structure of ownership is an extreme closely held ownership, because the relatively small amount of the owner are able to fully control management mechanism for maximizing the company’s financial performance. As the result, the degree of the agency problems between the owners with the manager tend to be low.

The public private bank moved the degree of the agency problems in Indonesia to conflict of the major owner’s interest and the minor one. Agency problem might be different if there was no major owner who controlled the management. The wide dispersed ownership by the public will move the agency problems to the conflict of interest between the dispersed owners with the manager. The condition in Indonesia indicated more in the major owner who controlled the management’s performance, so it’s potential in raising the conflict of the majority and the minority. The state-owned bank is a unique ownership because practically, there is no pure owner who can control to the company management. The government, both in context of the executive and legislative and all sides related with the management of the state-owned bank as an agent without principal. However, the state-owned bank is a chosen ownership that extremely against the closely held ownership, because the forms of the ownership are dispersed completely. So, the degree of the agency problem in this are is counted as the strongest relatively compared with the other forms of ownership.

Based on the typology of the ownership’s form and potential agency problems, it is possible to describe the agency problems in banking industry as in table 2-1. In the table, the agency problems might happen between the owner vs. manager and between the manager/ the owner vs. creditor or the minority.
Table 2-1. The agency problems and type of ownership in banking industry
Type of Conflict Reputable Foreign Bank Private Bank Public listed Bank State-owned Bank
(Proxy for GCG) Closely held Minority-majority Dispersed
Manager vs. owner
*
**
***
>
****
Manager/owner vs. Creditor/ Minority
*
**
***
****
Note: *= low** = high *** = higher **** = highest

RESEARCH MODEL
The agency problems caused firm performance cannot run optimally. The way to detect the agency problems is learning the management efforts which are related to external corporate governance as well as internal corporate governance. The different type of ownership have the different level of utility and the different ability in controlling the management. Figure 2-1 shows the research’s framework that bank performance is effected by three exogenous constructions.
Figure 1.
Research Framework


Operating Variables
External Corporate Governance. This research used the aspect of regulation and finance supervision as the reflection of external corporate governance by stressing the in the obedience factor to regulation and supervision. The composite variable of regulation obedience is in the form of logistic probability that is used as proxy of external corporate governance. The higher the probability of the regulation’s obedience and so higher the bank willingness to operate the company under the regulations. The external corporate governance variables that related to the regulation’s obedience consist of capital aspect and earning assets. This research used the government classification about the healthy and unhealthy bank during 1999 until 2001 to build analysis model. There are the evidence for the score: 1 for healthy bank and 0 for unhealthy bank. The unhealthy banks or under controlled banks reflect the consequence of the failed bank management attitudes or disobey the regulations. The healthy banks reflect the discipline of the bank management in obeying the regulations.

Internal Corporate Governance-manager are taken from pay-performance sensitivity. Jensen and Murphy (1990) had a research about pay-performance sensitivity. Pay-performance sensitivity is reflected from the parameter coefficient which is estimated with the pay regression model and the incentive to the wealth of the stakeholders. In this case ICGM is the internal corporate governance as the manager’s interest representation that are taken from the estimation of parameter coefficient.

Internal Corporate Governance-owner. ICG-owner is owner’s direct interference in the form of manager controls. Some of them are in actions on behalf of and for owner and the command for internal editor. The essence of the ICG- owner is in the efficiency factor of preventing manager from doing his own interest. Net interest margin (NIM) represents ICG- owner. This research has an assumption that the use of NIM in a period hasn’t reflected the appropriate mechanism for the owner in applying ICG owner. In other words, this research stresses to the stability of NIM from one to another period that reflected more in the success of the owner control mechanism than in the applying of NIM in a period. So that we use coefficient of variation NIM reflected internal corporate governance-owner interest.
Generally, empirical research of the effect of corporate governance and type of ownership to the bank performance can be explained by agency theory. However, there is a dimension of principal agency problems that are more complex in banking industry that cannot be found in non-financial banking industry. Besides, the existence of regulation factor as the reflection of public interest caused the control market mechanism as one of the mechanism of corporate governance to discipline the manager to become more useless. Moreover, with deposit insurance program, investors tend to be passived in controlling to prevent every risk increasing that are done by the owner or the stakeholder.

The agency theory, formalized by Jensen and Meckling (1976), posits that the agency costs of deviation from value maximization increase as managers’ stakes decrease and ownership becomes more disperse. Agency problem in banking industry in the context of corporate governance through the approach of ownership dispersion results as follow:
  • the interference of regulation in the concentrated ownership (private unlisted Bank) and dispersed ownership (state-owned bank) caused agency problems in high level degrees. This result is in line with the view that is based on the ownership’s aspect stated that the state-owned companies naturally are less efficient than the private companies. Governance view stated that private companies are more successful in handling the corporate governance problems than the state-owned companies. Reversely, private ownership are based on their skills that are better in contracting and incentives (Schleifer and Vishny (1994)
  • ;
  • Regulation intervention in less concentrated ownership (private listed bank) caused the agency problems fall in lower level degree. According to the agency theory, the separation of ownership and controlling functions between the principal and agents is possible to happen in the private listed bank than in the private unlisted bank. However, in banking industry, the agency problems that raised between the major and minor shareholders or between the manager- stakeholders “are ignored” by the function of regulator (Llewllyn and Sinha, 2000).

Market Risk Research

Jan 2, 2012 0 comments
Terdapat dua aliran penelitian tentang eksposur risiko pasar. Studi dalam aliran pertama menetapkan bahwa harga saham adalah sensitif terhadap perubahan suku bunga, nilai tukar, dan harga komoditas. Mereka juga menilai tingkat hubungan cross-sectional antara sensitivitas harga saham dengan perubahan nilai pasar/harga dan keterbatasan jumlah informasi risiko pasar yang tersedia pada penelitian sebelum FRR No. 48. Aliran kedua secara khusus membahas manfaat informasi yang dimandatkan oleh FRR No. 48.

Lima penelitian dalam aliran pertama berhubungan dengan studi ini. Schrand (1997), dengan menggunakan data regulator swasta, menunjukkan bahwa lembaga tabungan dan pinjaman menggunakan tingkat suku bunga derivatif dalam mengurangi sensitivitas harga ekuitas mereka terhadap perubahan tingkat suku bunga. Tufano (1998), menggunakan analyst-generated informasi prifat, menunjukkan bahwa harga komoditas hedging merendahkan sensitivitas harga saham tambang emas terhadap perubahan harga emas. Jorion (1990), dengan menggunakan pengungkapan publik, menemukan bahwa sensitivitas harga saham perusahaan terhadap harga dolar AS dari perdagangan tertimbang mata uang asing lebih besar pada perusahaan-perusahaan dengan operasi asing yang lebih tinggi. Bartov dan Bodnar (1994) mencatat bahwa pasar tidak sepenuhnya memasukkan informasi tentang sensitivitas perusahaan terhadap fluktuasi nilai tukar mata uang asing sampai sensitivitas tersebut mempengaruhi laporan laba akuntansi. Hasilnya menunjukkan bahwa pengungkapan publik tentang luasnya operasi asing hanya memberikan ukuran yang tidak lengkap dari sensitivitas risiko mata uang perusahaan. Terakhir, Wong (2000) mencatat bukti yang lemah dan tidak konsisten hubungan antara sensitivitas harga saham perusahaan terhadap perubahan nilai tukar dan posisi derivatif yang dilaporkan sesuai dengan persyaratan SFAS No 119 (FASB 1994d).

Studi dalam aliran penelitian pertama menunjukkan bahwa return sekuritas sensitif terhadap perubahan nilai pasar/harga. Mereka juga menunjukkan bahwa, sebelum FRR No. 48, sensitivitas harga saham perusahaan pada perubahan nilai pasar/harga dikaitkan dengan keterbatasan jumlah informasi risiko pasar industri spesifik. Namun, konsisten dengan review SEC tentang pengungkapan publik, mereka menemukan bahwa informasi SFAS No 119 tidak begitu berguna bagi investor. Tak satu pun dari studi tersebut memfokuskan pada kegunaan informasi FRR No. 48. Namun, Schrand (1997), yang menggunakan data regulator yang sama dengan pengungkapan tabular FRR No. 48, menunjukkan bahwa Disclosure FRR No. 48 mungkin berguna bagi investor. Demikian pula, Wong (2000) menunjukkan bahwa pengungkapan yang lebih komprehensif yang disyaratkan oleh FRR No. 48 adalah lebih baik dalam menggambarkan eksposur risiko pasar perusahaan dan mengatasi beberapa permasalahan defisiensi yang diidentifikasikan dalam informasi SFAS No. 119.

Literatur aliran kedua yang terkait, mencakup empat studi yang secara eksplisit memeriksa kegunaan informasi FRR No. 48. Namun, tiga dari yang pertama tidak menggunakan informasi aktual FRR No. 48. Selanjutnya, mereka mengembangkan proxy untuk Disclosure FRR No. 48 atas dasar informasi bahwa pengungkapan perusahaan minyak dan gas serta bank sebelum FRR No. 48 menjadi efektif. Untuk sampel penghasil minyak dan gas, Rajgopal (1999) membangun proxy untuk pengungkapan tabular dan pengungkapan sensitivitas FRR No. 48 dari pengungkapan cadangan nilai wajar (SFAS No. 69, FASB 1982) dan jumlah derivatif yang tidak tetap (SFAS No 119, FASB 1994d). Dia melaporkan hubungan positif antara proksi Disclosure FRR No. 48 dan sensitivitas return saham perusahaan pada perubahan harga minyak dan gas. Rajgopal dan Venkatachalam (2000), untuk sampel dari 25 indutri kilang minyak, menilai hubungan cross-sectional antara sensitivitas laba dan sensitivitas return pada harga minyak. Mereka menemukan hubungan positif antara proksi Disclosure sensitivitas laba FRR No. 48 dan persepsi pasar tentang eksposur risiko. Ahmed et.al. (2000) menguji maturity gap disclosure bank komersial. Mereka menemukan bahwa pengungkapan tersebut berguna dalam memprediksi perubahan net interest income bank. Terakhir, Thornton dan Welker (2000) menguji pengaruh pengungkapan aktual FRR No. 48 tentang penilaian pasar terhadap sensitivitas harga saham perusahaan pada perubahan harga minyak dan gas. Mereka menemukan bahwa penghasil minyak dan gas mengungkapkan analisis sensitivitas atau perubahan sensitivitas harga saham VAR experience lebih besar dari perubahan sensitivitas harga minyak dan gas pasca FRR No. 48 kemudian mentabulasi perusahaan disclosers dan nondisclosers.

Singkatnya, aliran kedua penelitian ini menunjukkan bahwa pengungkapan risiko pasar FRR No. 48 memberikan informasi yang berguna bagi investor. Namun, bukti-bukti sampai saat ini didasarkan pada sebagian besar proksi untuk informasi FRR No. 48, dan terbatas untuk perusahaan minyak dan gas serta industri perbankan. Sebaliknya, penelitian ini menguji efek pasar pengungkapan aktual FRR No. 48, dengan menggunakan sampel perusahaan non finansial yang luas. Selain itu, penelitian saat ini terutama menguji hubungan antara sensitivitas harga saham terhadap perubahan nilai pasar/harga dan informasi eksposur risiko pasar. Sebaliknya, penelitian ini menguji sensitivitas volume perdagangan harian pada perubahan nilai pasar/harga. Pada bagian berikutnya, penelitian ini menjelaskan mengapa sensitivitas tersebut berhubungan positif dengan ketidakpastian dan keragaman pendapat investor tentang eksposur risiko pasar perusahaan, dan mengapa penelitian ini memprediksi bahwa sensitivitas volume perdagangan tersebut menurun setelah pengungkapan FRR No. 48.

Recent Research
Penelitian sebelumnya menyimpulkan bahwa volume perdagangan meningkat dengan ketidakpastian dan keragaman pendapat investor (Karpoff 1986; Kim dan Verrecchia 1994; Kandel dan Pearson 1995; Barron 1995; Bamber et.al, 1997, 1999.). Model Kim dan Verrecchia (1994) tentang likuiditas pasar dan volume perdagangan memberikan dasar konseptual untuk pengembangan hipotesis.

Kim and Verrecchia (1994)
Model Kim dan Verrecchia (1994) menangkap dua fitur yang menonjol dari pengaturan pengungkapan: ketidakpastian/uncertainty (didefinisikan sebagai ketidak-akuratan informasi publik) dan keanekaragaman pendapat/diversity of opinion (didefinisikan sebagai 1 minus korelasi antara dua informasi). Dalam model ini, pelaku pasar menerima sinyal yang berisi informasi tidak tepat tentang ketidakpastian arus kas perusahaan di masa depan, dan memutuskan apakah akan mengenakan biaya dalam pemrosesan lanjutan sinyal informasi nilai relevan. Meskipun Kim dan Verrechia (1994) (selanjutnya KV) menerapkan model mereka pada sinyal release laba yang berisi informasi tentang antisipasi arus kas perusahaan, penelitian ini menerapkan model dengan perubahan dalam sinyal nilai pasar/harga (seperti perubahan suku bunga, nilai tukar, atau harga komoditas). Pergerakan nilai pasar/harga bukan merupakan sinyal spesifik perusahaan, namun literatur sebelumnya menunjukkan bahwa hal ini memiliki implikasi spesifik perusahaan karena berhubungan dengan return ekuitas dan laba (Jorion 1990; Schrand 1997; Tufano 1998; Ahmed et.al, 2000). Penelitian ini menempatkan bahwa implikasi spesifik perusahaan dari pergerakan tersebut untuk mengantisipasi arus kas masa depan yang tidak jelas sebelum FRR No. 48, ketika investor memiliki sedikit informasi atau tidak terdapat informasi tentang eksposur bersih risiko pasar perusahaan.

Sinyal pada model KV merangsang investor untuk terlibat dalam pengolahan informasi yang mahal/mengandung biaya karena implikasi dari sinyal antisipasi arus kas perusahaan adalah untuk penafsiran. Investor karena itu merasa bahwa mereka bisa mendapatkan keuntungan informasi melalui pengolahan informasi yang mahal/mengandung biaya. Sejumlah investor memilih untuk mengeluarkan biaya guna memproses informasi, dalam upaya untuk mendapatkan keuntungan melalui perdagangan informasi, mereka merasa dapat mencapai peningkatan keuntungan informasi dari pengolahan informasi. Informasi publik kurang tepat dalam meningkatkan penerimaan return untuk menentukan implikasi sinyal spesifik perusahaan, meningkatkan kesediaan sejumlah investor untuk memproses informasi dan memperdagangkannya. Adanya potensi keuntungan dari perdagangan informasi, memungkinkan pengolahan informasi menjadi mahal/mengandung biaya, juga meningkatkan pertentangan pelaku pasar (misalnya, memiliki keragaman pendapat) tentang implikasi penilaian sinyal.

Theoritical Framework
Penelitian ini mengusulkan bahwa ketika investor belajar dari perubahan nilai pasar/harga, seperti perubahan suku bunga, mereka memutuskan apakah biaya tersebut efektif untuk mendapatkan keuntungan informasi dengan memproses informasi yang mahal/mengandung biaya untuk menentukan implikasi arus kas perusahaan dari laju/perubahan harga yang lebih baik. Review awal SEC tentang pengaruh pengungkapan FRR No. 48 yang diuraikan pada Bagian II, menunjukkan bahwa sebelum perusahaan membuat pengungkapan, terdapat kelangkaan informasi mengenai eksposur risiko pasar bersih perusahaan. Oleh karena itu, (1) implikasi arus kas perusahaan dari perubahan nilai pasar/harga cenderung tidak tepat, dan (2) karena ketidaktepatan ini, investor melakukan pengolahan informasi yang mahal/mengandung biaya terhadap perubahan nilai pasar/harga, yang kemungkinan besar informasi tersbut memiliki pendapat yang beragam (diversity of opinion) tentang implikasinya bagi nilai perusahaan. Misalnya, sebelum pengungkapan FRR No. 48, investor melihat kenaikan poin sepuluh-basis suku bunga akan cenderung memiliki penilaian yang tidak tepat dan pendapat yang beragam tentang implikasinya bagi perusahaan.

Smithson et.al,. (1995) berpendapat bahwa perubahan tingkat suku bunga, nilai tukar, dan harga komoditas secara umum mengikuti proses random-walk. Ini menunjukkan bahwa pada umumnya, investor melihat perubahan terbaru nilai pasar/harga seperti sebagai sesuatu yang permanen yang mempengaruhi besarnya harapan arus kas masa depan perusahaan. Efek potensial nilai perusahaan dari perubahan nilai pasar/harga akan meningkatkan besarnya perubahan rata-rata/harga. Jadi, atas dasar tingkat ketidakpastian dan keragaman pendapat investor tentang implikasi perubahan arus kas, manfaat yang dirasakan dari pengolahan informasi yang mahal/mengandung biaya akan meningkatkan nilai absolut perubahan. Ini berarti bahwa ketika sejumlah investor memutuskan untuk memproses perubahan nilai pasar/harga, akan diikuti meningkatnya informasi sebesar nilai absolut dari perubahan rata-rata/perubahan harga.


Penelitian ini juga berhipotesis bahwa setelah informasi FRR No. 48 tersedia, penilaian investor pada eksposur perusahaan pada perubahan nilai pasar/harga lebih tepat dan homogen daripada periode sebelum FRR No. 48. Dalam model KV, peningkatan ketepatan dan berkurangnya keragaman pendapat cenderung mengurangi manfaat yang dirasakan dari pengolahan informasi untuk setiap tingkat dari perubahan nilai pasar/harga. Dengan demikian, sejumlah investor memilih untuk terlibat dalam pengolahan informasi yang mahal/mengandung biaya dan perdagangan cenderung lebih rendah.

Dasar Pemikiran untuk Fokus pada Volume Perdagangan
Model KV menyiratkan bahwa ketidakpastian dan keragaman pendapat investor dapat mempengaruhi perubahan harga dan ukuran likuiditas pasar, seperti bid-ask spread, disamping volume perdagangan. Selain itu, Barron et.al,. (1998) menyarankan penggunaan properti analis peramalan untuk menguji pengaruh pengungkapan pada ketidakpastian dan keragaman pendapat investor.

Pengujian empiris penelitian ini berfokus pada volume perdagangan daripada ukuran lain (bid-ask-spread) dengan alasan sebagai berikut. Pertama, literatur sebelumnya (Bamber dan Cheon 1995; Barron 1995; Kandel dan Pearson 1995; Bamber et.al, 1997, 1999.) mencatat hubungan yang reliabel antara volume perdagangan dan ketidakpastian dan keragaman pendapat investor (juga disebut perselisihan). Literature tersebut juga mencatat bahwa pertentangan dan/atau perbedaan pendapat yang berkaitan dengan volume perdagangan dapat terjadi tanpa adanya perubahan harga. Sebagai contoh, Bamber dan Cheon (1995) menemukan bahwa pengumuman laba merangsang volume perdagangan yang relatif lebih tinggi terhadap besarnya perubahan harga absolut yang terkait dengan perbedaan yang lebih besar dalam analisis peramalan laba sebelum pengungkapan. Temuan ini menunjukkan bahwa ketidakpastian dan / atau keragaman pendapat investor cenderung berhubungan lebih kuat dengan volume dibandingkan dengan perubahan harga. Kedua, bid-ask spread menyediakan hanya ukuran kasar dari likuiditas pasar (Callahan et.al,. 1997).

Ketiga, karena analis tidak meng-update peramalan laba harian, tidak mungkin untuk menyesuaikan revisi peramalan laba dengan perubahan harian nilai pasar/harga, seperti yang dibutuhkan dalam penelitian ini. Akhirnya, perubahan nilai pasar/harga dapat mempengaruhi nilai perusahaan dan arus kas masa depan yang diharapkan tanpa mempengaruhi laba periode berikutnya. Sebagai contoh, perubahan nilai pasar/harga dapat mengubah kemungkinan perkiraan nilai transaksi yang terjadi di luar tahun berjalan. Demikian pula, perubahan yang mempengaruhi nilai wajar instrumen keuangan yang dicatat sebesar biaya historis, tidak mampu mendekati revisi peramalan laba kecuali analis tersebut memperkirakan perusahaan akan menjual instrumen dalam waktu dekat. Properti model akuntansi lebih lanjut mengurangi kegunaan peramalan analis dalam setting penelitian ini.

Sebagai alasan, penelitian ini percaya bahwa sensitivitas volume perdagangan pada perubahan nilai pasar/harga adalah ukuran yang paling tepat untuk menguji hipotesis penelitian ini. Penelitian ini tetap mengakui bahwa volume perdagangan adalah noisy proxy untuk ketidakpastian dan keragaman pendapat. Penelitian sebelumnya mengungkapkan bahwa proxy untuk pertentangan (disagreement) secara signifikan berhubungan dengan volume perdagangan, namun kekuatan penjelas dari model tersebut rendah, dengan R2 kurang dari 20 persen (misalnya Barron 1995; Bamber et.al, 1997, 1999). Selain itu, investor berdagang untuk alasan lain selain ketidakpastian investor atau keragaman pendapat (misalnya, portfolio rebalancing, likuiditas).

Quantitative Market Risk Disclosure

Jan 1, 2012 0 comments
Komisi Sekuritas dan Bursa (SEC) telah menerbitkan Release Laporan Keuangan No 48 (SEC 1997, yang selanjutnya disebut “FRR No. 48”), yang memandatkan pengungkapan risiko pasar kuantitatif ke depan dalam 10-K report perusahaan. FRR No. 48 mendefinisikan risiko pasar sebagai risiko kerugian berkaitan dengan perubahan yang merugikan (adverse changes) dalam nilai pasar atau harga, seperti suku bunga, nilai tukar, dan harga komoditas. Setelah publikasi terkait dengan kerugian derivatif pada 1990-an, FRR No. 48 menanggapi banding dari investor dan konstituen lain untuk pengungkapan publik yang disempurnakan dari eksposur perusahaan terhadap risiko pasar (Linsmeier dan Pearson, 1997). Studi ini memberikan bukti yang berkaitan dengan klaim SEC (1997) bahwa Disclosure FRR No. 48 memberikan informasi yang bermanfaat bagi investor.

Disclosure FRR No. 48 dapat bermanfaat bagi investor setidaknya dalam dua cara. Pertama, pada release 10-K report, investor dapat menggunakan kandungan informasi dalam pengungkapan untuk merevisi atau mengkonfirmasi harapan mereka tentang eksposur perusahaan pada tingkat suku bunga, nilai tukar, dan/atau perubahan harga komoditas. (Selanjutnya mengacu pada perubahan secara kolektif “perubahan nilai pasar/harga”). Sejauh bahwa pengungkapan mengubah ekspektasi pasar, hal ini dapat menyebabkan perubahan harga saham perusahaan, risiko sistematis, atau sensitivitas harga saham pada perubahan nilai pasar/harga dalam satu waktu. Kedua, investor dapat menggunakan estimasi revisi mereka tentang eksposur risiko penilaian implikasi nilai perusahaan atas perubahan nilai pasar/harga yang terjadi setiap saat setelah tanggal release 10-K. Penggunaan informasi yang terkandung dalam pengungkapan FRR No. 48 secara terus menerus akan mengurangi ketidakpastian dan keragaman pendapat investor tentang implikasi perubahan nilai pasar/harga dari nilai perusahaan, model teoritis Kim dan Verrecchia's (1994) menunjukkan bahwa seharusnya mengamati kurang sensitifnya volume trading terhadap perubahan nilai pasar/harga setelah tanggal release 10-K.

Deskripsi FRR No. 48
Pengantar FRR No. 48 menyatakan bahwa pengungkapan “dirancang untuk memberikan informasi tambahan mengenai sensitivitas instrumen risiko pasar, dimana investor dapat menggunakan pemahaman yang lebih baik dan mengevaluasi eksposur risiko pasar registran” (SEC 1997, 3). SEC mempunyai kaitan dengan penyediaan full dan fair disclosure pada investor individu dan memastikan bahwa mereka “berada pada tingkat permainan lapangan dengan insider pasar” (SEC 2000, 2) karena “today’s self-directed, investor online tidak berharap untuk bergantung secara eksklusif pada penelitian dan analisis yang dilakukan oleh para profesional” (SEC 2000, 3). Dalam FRR No. 48, SEC berjanji untuk memonitor efektivitas persyaratan pengungkapan dan mengubahnya jika sesuai. Hal tersebut juga dijanjikan Kongres bahwa mereka akan melakukan penelaahan dampak pengungkapan risiko pasar setelah tiga tahun berlalu. Sementara review berlangsung, terdapat literatur akademis yang tidak meyakinkan apakah pengungkapan risiko pasar berguna bagi investor.

Literatur ekonomi keuangan menunjukkan bahwa pengungkapan risiko pasar dapat mengurangi asimetri informasi antara manajer dan investor, jika perusahaan mengelola risiko untuk alasan yang tidak transparan kepada investor. Dalam pasar modal yang sempurna, hedging tingkat-perusahaan atas suku bunga, nilai tukar, atau harga komoditas tidak efisien karena investor dapat mendiversifikasi risiko tersebut menurut preferensi risiko mereka sendiri (DeMarzo dan Duffie 1991). Dalam pasar yang tidak sempurna, manajemen risiko perusahaan dapat meningkatkan nilai perusahaan dalam beberapa cara. Hal ini termasuk mengurangi antisipasi pembayaran pajak, mengurangi kemungkinan biaya financial distress, melindungi investasi, menanggapi penghindaran risiko manajerial, dan meningkatkan penerimaan nilai perusahaan oleh tren peningkatan perataan laba (Smith dan Stultz 1985; Nance et.al, 1993; DeMarzo dan Duffie 1995; Mian 1996; Tufano 1996; Barth et.al, 1999). Jika investor tidak secara langsung mengamati aktivitas manajemen risiko, kemudian pengungkapan eksposur kuantitatif ke depan (forward looking) yang dihasilkan dari kegiatan tersebut memiliki potensi untuk menyampaikan informasi yang berguna bagi pasar dan meningkatkan pemahaman investor tentang eksposur risiko pasar perusahaan.

FRR No. 48 mewajibkan perusahaan untuk mengungkapkan informasi risiko pasar kuantitatif dalam pengajuan 10-K untuk setiap kategori material risiko pasar (misal, risiko suku bunga, risiko nilai tukar, risiko harga komoditas). Dalam setiap kategori risiko, FRR No. 48 memungkinkan perusahaan untuk menampilkan informasi risiko pasar kuantitatif dengan menggunakan tiga format alternatif:
  • Tabel Penyajian (tabular presentation) nilai wajar dan dokumen kontrak yang memadai untuk menentukan sensitivitas instrumen risiko pasar jumlah arus kas masa depan dengan tanggal jatuh tempo yang diharapkan.
  • Analisis Sensitivitas (sensitivity analysis) yang menggambarkan kemungkinan pengaruhnya pada laba, arus kas, atau seleksi nilai wajar, hipotesis perubahan nilai pasar/harga.
  • Value-at-risk (VAR) disclosure mengekspresikan potensi kerugian dalam laba, arus kas, atau nilai wajar dari perubahan nilai pasar/harga dengan probabilitas yang terjadi.
Perusahaan dapat menggunakan format pengungkapan kuantitatif yang berbeda di seluruh kategori eksposur. Lampiran memberikan contoh dari setiap format pengungkapan.

Konsisten dengan tujuan mandating disclosure yang berhubungan dengan semua sensitivitas instrumen risiko pasar, FRR No. 48 mensyaratkan Disclosure risiko pasar 10-K yang melekat dalam derivatif dan lainnya, termasuk instrumen keuangan nonderivative dalam ruang lingkup SFAS No. 107 (FASB 1991a), misalnya, investasi, pinjaman, catatan terstruktur, dan kewajiban utang. FRR No. 48 (SEC 1997, Bagian II) mengingatkan registran SEC bahwa eksposur risiko pasar mungkin timbul dari instrumen dan posisi yang berada di luar cakupan eksplisit dari aturan, seperti posisi komoditas dan arus kas dari antisipasi transaksi. Hal ini mendorong perusahaan untuk memasukkan instrumen dan posisi tersebut dalam pengungkapan mereka secara sukarela atau untuk membahas pengecualian mereka sebagai keterbatasan pengungkapan.

SEC mensyaratkan dua kelompok perusahaan, yang dianggap paling familiar dengan ukuran dan pengelolaan risiko pasar, untuk mematuhi FRR No. 48 dalam tahun fiskal yang berakhir setelah 15 Juni 1997: (1) Bank dan thrift institution, serta (2) perusahaan non finansial dengan kapitalisasi pasar modal melebihi $2.500.000.000 pada 28 Januari 1997. Semua perusahaan-perusahaan lain harus mematuhi FRR No. 48 dalam catatan SEC untuk tahun fiskal yang berakhir setelah 15 Juni 1998. Penelitian ini fokus pada pengungkapan 10-K yang pertama dari perusahaan non finansial yang disyaratkan untuk mematuhi FRR No. 48 dalam tahun fiskal yang berakhir setelah 15 Juni 1997.

Penelitian ini mengevaluasi pengaruh tambahan FRR No. 48 mengingat persyaratan pengungkapan yang mendahuluinya. Pada tahun 1997, pembuat standar akuntansi telah mempertimbangkan laporan keuangan perusahaan untuk instrumen keuangan untuk hampir setiap dekade. Beberapa kerugian terkait derivatif yang dipublikasikan pada tahun 1994 mempercepat laju pernyataan akuntansi (Baliga 1994; Loomis 1995). Namun, bahkan setelah penerbitan SFAS No 119 (FASB 1994d), pernyataan dimaksudkan untuk meningkatkan pengungkapan perusahaan tentang derivatif, melakukan kajian internal terhadap sekitar 500 pengajuan 10-K (SEC 1995) menemukan dua kekurangan dalam pengungkapan risiko pasar:
  1. Kekurangan kualitatif: Sebelum FRR No 48, hanya diamanatkan pengungkapan risiko pasar forward-looking yang bersifat kualitatif, dan tergolong hanya untuk instrumen keuangan derivatif yang diterbitkan untuk tujuan lain selain perdagangan. Untuk instrumen ini, SFAS No. 119 membutuhkan pengungkapan “tujuan entitas untuk memegang atau menerbitkan instrumen keuangan derivatif, konteks yang diperlukan untuk memahami tujuan tersebut, dan strategi umum untuk mencapai tujuan tersebut” (FASB 1994d, par.11a). Namun, dengan memfokuskan pada derivatif tertentu dalam isolasi, pengungkapan tersebut tidak memberikan investor pemahaman yang lengkap tentang tujuan dan strategi manajemen risiko perusahaan. FRR No. 48 mengarahkan penghilangan ini dengan mewajibkan pengungkapan informasi kualitatif serupa untuk seperangkat instrumen yang lebih luas, termasuk instrumen keuangan non-derivative dan instrumen komoditas derivatif.
  2. Kekurangan kuantitatif: Sebelum FRR No. 48, pengungkapan kuantitatif terkait dengan sensitivitas instrumen risiko pasar sangat terbatas. SFAS No. 119 memandatkan pengungkapan dalam jumlah yang tidak tetap dari instrumen keuangan derivatif (FASB 1994d, par. 8b), sedangkan Aturan 5-02 regulasi S-X mensyaratkan pengungkapan sifat dan jangka waktu kewajiban utang. SEC mencatat bahwa informasi tersebut: (i) sering disingkat, (ii) disajikan sedikit demi sedikit dalam bagian yang berbeda dari laporan keuangan, dan (iii) tidak berlaku untuk semua instrumen risiko pasar yang sensitif. Dengan demikian, investor sering tidak dapat menilai apakah atau bagaimana instrumen keuangan dan komoditas tertentu mempengaruhi eksposur risiko pasar bersih registran. (SEC 1995, bagian IIIB1)


Sebelum FRR No. 48, investor memiliki ketidak-cukupan informasi untuk menilai eksposur risiko pasar perusahaan. PSAK No 119 mendorong, tetapi tidak mensyaratkan, pengungkapan informasi kuantitatif mengenai risiko pasar yang melekat pada instrumen keuangan derivatif dan instrumen keuangan lainnya. Menurut SEC, sebelum FRR No 48, perusahaan hampir tidak pernah mengungkapkan informasi tersebut secara sukarela (SEC 1995, Bagian IIIB1a). Informasi kuantitatif tentang risiko pasar yang melekat pada posisi non-derivatif sangat terbatas, sehingga sulit untuk menilai bagaimana mengubah eksposur bersih derivatif perusahaan pada perubahan nilai pasar/harga. Hasil survei terhadap investor dan kreditur, Panitia Khusus AICPA's pada Pelaporan Keuangan menyatakan, “pengguna mengeluh bahwa laporan bisnis tidak menjawab pertanyaan penting, seperti: Apa instrumen [inovasi keuangan] perusahaan, dan apa syarat mereka? Apakah resiko perusahaan telah dialihkan atau diambil?” (AICPA 1994, 76). FRR No. 48 berusaha untuk memperbaiki kekurangan tersebut dengan memandatkan ke depan, pengungkapan kuantitatif tentang eksposur bersih perusahaan untuk risiko pasar.

Sebaliknya, kritik FRR No. 48 menyebutkan dua alasan utama bahwa pengungkapan tidak mungkin informatif. Pertama, manajer dapat memilih format pengungkapan kuantitatif dan dapat mendasari pengungkapan mereka pada asumsi questionable tentang peristiwa dan tindakan masa depan. Pada Januari 1997 memo internal dari Kepala Ekonomi SEC menunjukkan bahwa subjektivitas dalam pengukuran risiko kuantitatif memungkinkan manajer untuk memberikan gambaran yang keliru mengenai eksposur risiko pasar bersih perusahaan, yang berpotensi menyesatkan investor (Beckett 1997; Logan dan Montgomery 1997). Kedua, investor cenderung memiliki kesulitan memproses probabilitas informasi yang terkandung di beberapa Disclosure FRR No. 48 dan membandingkan eksposur pengungkapan tabular, sensitivitas, dan VAR perusahaan (Hodder et.al, 2001.). Oleh karena itu, kritik FRR No. 48 berpendapat bahwa pengungkapan tidak dapat memperbaiki “penilaian investor” pada eksposur risiko pasar perusahaan.

Pada bulan Juli 1998, staf SEC melaporkan kepada Kongres pada tahun pertama pengajuan FRR No. 48, termasuk hasil survei sejumlah analis dan investor mengenai pengalaman mereka dengan FRR No. 48. Tanggapan menunjukkan bahwa pengungkapan memberikan informasi baru dan berguna. Laporan staf SEC menyatakan, “Investor mengantisipasi bahwa di masa depan mereka akan membandingkan pengungkapan risiko pasar registran dengan hasil aktual, pengungkapan masa lalu registran dan pengungkapan registran lain” (SEC 1998, 9-10). Namun, survey responden juga menyatakan bahwa “terlalu dini untuk mengatakan apakah pengungkapan menghasilkan pasar yang lebih efisien” (SEC 1998, 2).

Summary of CSR Study

Dec 26, 2011 0 comments
Dilihat dari sudut pandang paradigma penelitian serta tujuan penelitian yang hendak dicapai beberapa penelitian dalam studi CSR, menggunakan dua pendekatan yaitu positivistik dan non positivistik. Penelitian positivistik digunakan menjawab tipe masalah penelitian yang bertujuan untuk menjelaskan what is (explaining what is), sementara penelitian non positivistik merupakan bentuk penelitian diskriptif yaitu bertujuan untuk menjelaskan fenomena (social world) atau describe what is dan penelitian normatif untuk mesdiskripsian bagaimana seharus satu objek (describeing what should be).

Freedman dan Jaggi (1974) mengelompokkan peta penelitian berkaitan dengan pertanggungjawaban sosial perusahaan terhadap lingkungan, menjadi: (1) keterkaitan antara pengungkapan sosial dengan kinerja sosial; (2) keterkaitan antara kinerja sosial dengan kinerja ekonomi; (3) keterkaitan antara kinerja ekonomi dengan pengungkapan sosial; dan (4) keterkaitan antara kinerja ekonomi dengan kinerja sosial.

Adam. C.H, (2002) menyatakan, bahwa berangkat dari perkembangan penelitian terdahulu riset tingkat pengungkapan sosial di broken down menjadi tiga wilayah, yaitu: (1) kaitannya dengan karakteristik perusahaan (corporate characteristics); (2) kaitannya dengan faktor-faktor kontektual umum (general contextual factors); dan (3) keterkaitannya dengan faktor-faktor internal (internal contextual factors). Pembidangan daerah perkembangan akuntansi sosial (social accounting) tersebut, berkaitan dengan motif ekonomi dan sosial, tekanan pihak diluar serta upaya membangun image perusahaan didepan stakeholders-nya.

Mathews (1995) melengkapi pola pikir social responsibility dan motif manajemen yang dikaitkan dengan kaidah information usefullness, bahwa terdapat tiga argumen dasar peran akuntansi konvensional dalam rangka membantu pengambilan keputusan spesifik, khususnya tentang pengungkapan sukarela, antara lain: (1) keterkaitan dengan pasar modal, hal ini didasarkan pada premis bahwa pengungkapan pertangungjawaban sosial memiliki pengaruh positif terhadap kinerja pasar; (2) keterkaitan dengan legitimasi manajemen; dan (3) keterkaitan kontrak (the notion of social contract) antara perusahaan terhadap masyarakat sekitar yang merupakan representasi dari company’s moral accountability.

Arieh A. Ulmann (1985) setelah melakukan review riset selama 10 tahun menemukan bahwa peta pengembangan penelitian dibidang pertanggungjawaban sosial dibedakan, atas: (1) keterkaitan antara social disclosure terhadap social performance; (2) keterkaitan social performance terhadap economics performance; dan (3) keterkaitan social disclosure terhadap economics performance. Untuk lebih rinci temuan tersebut dijelaskan dalam tabel sebagai berikut:
Tabel. 1
Rangkuman Perkembangan Riset
Di Bidang Social Responsibility (Social Accounting)


Tipe HubunganPenelitiHasilKeterangan
Social Performance - Social DisclosureBelkoui dan Karpik (1989)positive significanceSocial disclosure diukur dengan CEP Index
Abbot dan Monsen (1979)positive significance
Ulmann (1983)no association
Social Disclosure - Social PerformanceBowman dan Haire (1975)positive significance14 perusahaan, social disclosure diukur dengan kalimat yang ada dalam annual report
Abbott dan Monsen (1979)positive significance23 perusahaan, untuk mengukur social disclosure menggunakan Ernst&Ernst
Freedman & Jaggi (1982)no association31 perusaahan, quality & quantity of disclosure in annual report
Ingram & Fraizer (1980)no association40 perusahaan, social disclosure diukur dengan pollution index
Fry & Hocke (1976)negative not sig.135 perusahaan, quality & quantity of disclosure in annual report
Preston (1978)no association41 perusahaan, social disclosure from Ernst & Ernst index
Wiseman (1982)positive not significance26 perusahaan, quality & quantity of disclosure in nannual report
social disclosureeconomics performanceAbbott & Monsen (1979)positive sign.450 perusahaan, social disclosure diukur dengan score based on Ernst & Ernst, dan ecocomics performance diukur dengan ROE 1964 -1974
Bowman (1978)positive sign.46 perusahaan, social disclosure diukur dengan percent of prose in aanual report, economics performance diukur dengan ROE 1972-1974
Bowman & Haire (1975)U. Shape correlation highest ROE for middle disclosure82 perusahaan, social disclosure diukur dengan percent of prose in annual report, economics performance diukur dengan ROE 1969-1973
Freedman dan Jaggy (1982)no association109 perusahaan yang memiliki kepekaan terhadap penciptaan pollusi, social disclosure diukur dengan quality & quantity of pollution disclosure in nannual report, economics performance diukur dengan ROA, ROE, Cash Flows/E, EBIT/A, EBIT/E
Fry & Hock (1976)negative sign.109 perusahaan dari 15 industri, social disclosure diukur dengan quality & quantity of pollution disclosure in nannual report, economics performance diukur dengan earnings
Ingram dan Frizer (1983)negative not sign.79 perusahaan dari metal, oil, chemical industries, social disclosure diukur dengan computerized content analysis of annual report, economics performance diukur dengan factor analysis 0f 48 acoounting rations
Preston (1978)Berpengaruh lemahFortune 500 firm, social disclosure diukur dengan quantity of disclosure in 2 years between 1972 dan 1975, economics performance diukur dengan ROE 1975
Anderson & Francle (1980)Positive correlation for certain months for disclosure vs nondisclosure314 of 1872 Fortune 500 firm, social disclosure diukur dengan overall disclosure and type of disclosure based Ernst & Ernsr, economics performance monthtly average residual differences 7/1972-6/1973
Belkoui (1976)Positive yet temporary correlation50 nperusahaan dan pengungkapan pada tahun 1976, social disclosure diukur dengan pollution disclosure in nannual report, economics performance diukur dengan monthly average residual, 12 months prio & after disclosure
Ingram (1978)Tidak terdapat pengaruh pada portofolio means, memiliki pengaruh positif pada market segmen287 of 1970-1976 Fortune 500 firm, social disclosure diukur dengan various types of disclosuire in annual report, economics performance diukur dengan monthly portofolio return 9 months prior and 3 months after fiscal year end
Shane & Spicer (1983)Significant net price decrease 1 & 2 days prior release, largest decrease for worst pollution72 0f 103 firm from CEP sampel, social disclosure dukur dengan CEP pollution performance index, economics performance diukur dengan standardized abnormal means-adjusted daily return for 6 days around release date of Council on economics priority study
Social Cost, Social Performance, Economics Performance, & Social DisclosureMemed Sueb (2001)Terdapat pengaruh social cost terhadap social performancePerusahaan yang mengikuti Prokasih, dimana social cost dan social performance merupakan data primer berupa pendapat responden yang termuat dalam kuesioner


Peregesran paradigma pengelolaan perusahaan dari shareholders orientation? dianggap menjadi pemicu pergeseran orientasi pengelolaan perusahaan, yaitu semakin tingkat perhatian dan keterbukaan akan hak dan tanggungjawab, termasuk perhatian terhadap lingkungan, kedua dampak negative externalities industrialisasi telah merasuk dalam berbagai dimensi kehidupan baik pisik maupun psikis. Hal itu, menjadikan stress sosial, radiasi, pencemaran, dis-harmoni hubungan antara perusahaan dan stakeholders terutama external stakeholders sehingga mengancam illigitasi stakeholders terhadap perusahaan.

Melihat konteks seperti itu, perusahaan harus menggeser pengelolaan oerusahaan denga memperhitung faktor-faktor sosial dan kemasyarakatan yang diwujudkan lewat corporate social responsibility. Secara teoretis, fenomena itu dijelaskan secara logis dalam teori stakholders (stakeholders theory) yang mana antara perusahaan dan stakeholders berada dalam garis lurus yaitu saling mempengaruhi dan dipengaruhi baik langsung maupun tidak langsung. Untuk menghindari dis-legitimasi, perusahaan perlu menjaga congruensi tujuan perusahaan dengan pengharapan stakeholders (legitimacy theory), seperti dengan mengadakan kontrak sosial (social contract) berupa meningkatkan praktik corporate social responsibility.

corporate social responsibility dalam tataran praksis ternyata memiliki muatan strategis, dilihat dari sisi perusahaan mengandung motif baik bersifat sosial maupun ekonomi. Dampak riil dalam operasional perusahaan memiliki muatan untuk meningkatkan kinerja perusahaan baik kinerja sosial (social performance) maupun economics performance.

Cakupan tingkat signifikansi social responsibility ternyata mengundang deru perhatian semua pihak baik oleh praktisi maupun akademisi. Untuk itu, perkembangan kajian corporate social responsibility merambah dalam berbagai ranah baik dikaitkan dengan konteks perusahaan, external stakeholders, motif yang terkandung didalamnya, managerial motive, stakeholders motive, information usefullness dan information content dan sejenisnya. Melihat konteks seperti itu, riset dibidang corporate social responsibility memiliki peran penting dalam perkembangan ilmu dibidang akuntansi yaitu perkembangan akuntansi sosial dan lingkungan.

(Sumber: Noorhadi, 2011)